POS Scan Universe Definitions
- Scan Units – Volume of Sales. This is a total of units sold for all items in all transactions in each store, or at the Point of Sale (POS), and is reported based on the items, stores and timeframes chosen.
- Scan Dollars – Value of Sales. This is a total of all dollars spent for all items in all transactions in each store, or at the Point of Sale (POS), and is reported based on the items, stores and timeframes chosen.
- Scan Price – Sales Price per Unit. This is a calculation based on Dollars / Scan Units, done at the item level.
- Stores Scanning – Number of Selling Stores. This is the total number of stores that had a transaction based on the items, store and timeframes chosen in your report.
- Dollars per Store – Average Sales Price per Store. This is a calculation based on Dollars / Store Count for the items, stores, and timeframes chosen in your report.
- Units per Store – This is a calculation based on Units/Stores Selling for the items, stores and timeframes chosen in your report.
- Units/Store/Week – This is a calculation based on Units/Stores Selling/# of weeks for the items, stores and timeframes chosen in your report.
- Item Count – Number of Items. This is a count of unique items (NOT total items) based on the entities chosen in your report.
- Basket Count – The number of baskets. This is the total number of transactions based on the items, stores and timeframes chosen in your report. When using a Sales Report, the information is provided at the item level, but not available in any roll-up.
- Items per Basket – Number of actual product pieces a consumer had in the basket.
- Scan Dollars per Basket – Average Sales Price per Basket. This is a calculation based on Dollars / Basket Count for the items, stores and timeframes chosen in your report.
- Scan Units per Basket – This is a calculation based on Units / Basket Count for the items, stores and timeframes chose in your report.
- Basket Count % - The % of baskets. This value is shown for each entity in your report as a % of the total basket count for all entities chosen (your reference entity), based on the items, stores and timeframes chosen in your report. For example, in the report below the categories show each the category’s basket count as a % of all baskets. In this example, Cold & Allergy was in 7.2% of all baskets.
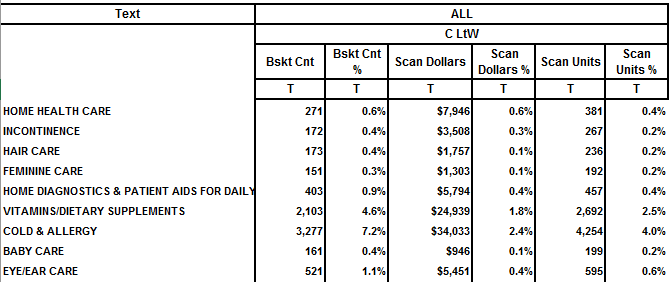
- Scan Units % – Percentage of Total Volume of Sales. This value is shown for each entity in your report as the % of the total Units sold for all entities chosen, based on the stores and timeframes chosen in your report. As shown in the example above, the categories listed show Unit Sales as a % of Total Unit Sales. In this example, Cold & Allergy accounted for 4.0% of all Unit Sales.
- Scan Dollars % - Percentage of Total Value of Sales. This value is shown for each entity in your report as the % of the total Dollar Sales for all entities chosen (your reference entity, in this case categories), based on the stores and timeframes chosen in your report. As shown in the example above, the categories listed show Dollar Sales as a % of Total Dollar Sales. In this example, Cold & Allergy accounted for 1.0% of all Dollar Sales.